Why we migrated away from Librato to InfluxDB?
by Tomaž Kovačič & Nejc Saje · 10 May 2016About 2 years ago we’ve jumpstarted our Native DSP platform. At the time we needed to move fast and think tactically. Making sure we make the most of our time every step of the way.
Setting up and managing the infrastructure for a metrics backend like Graphite was certainly not considered a priority at the time. So we started out with a managed metrics service and then migrated our metrics infrastructure to a modern open source stack.
Metric Types
Our application emits a ton of metrics of various types:
- Performance metrics - per request timers and counters, internal api call timers, …
- Application state metrics - e.g. number of items waiting for processing
- System level performance metrics - e.g. AWS CloudWatch data on RDS & SQS
- Composite metrics - metrics that are a function of other metrics i.e. if you have requests per second and number of cores in your autoscale cluster, you can observe requests per second per core
To manage all these metrics we require a metrics backend capable of ingesting measurements in real time and a flexible data visualization platform with a capability of displaying large number of metrics on standalone screens we have hanging on various parts of our office.
We consider New Relic as a great addition to the end solution, but not as a standalone-solve-it-all platform for our requirements.
Starting with Librato
At that time Librato offered a great shortcut to get up and running quickly without having to worry about any capacity planning, since librato offered that we simply pay everything “on demand”.
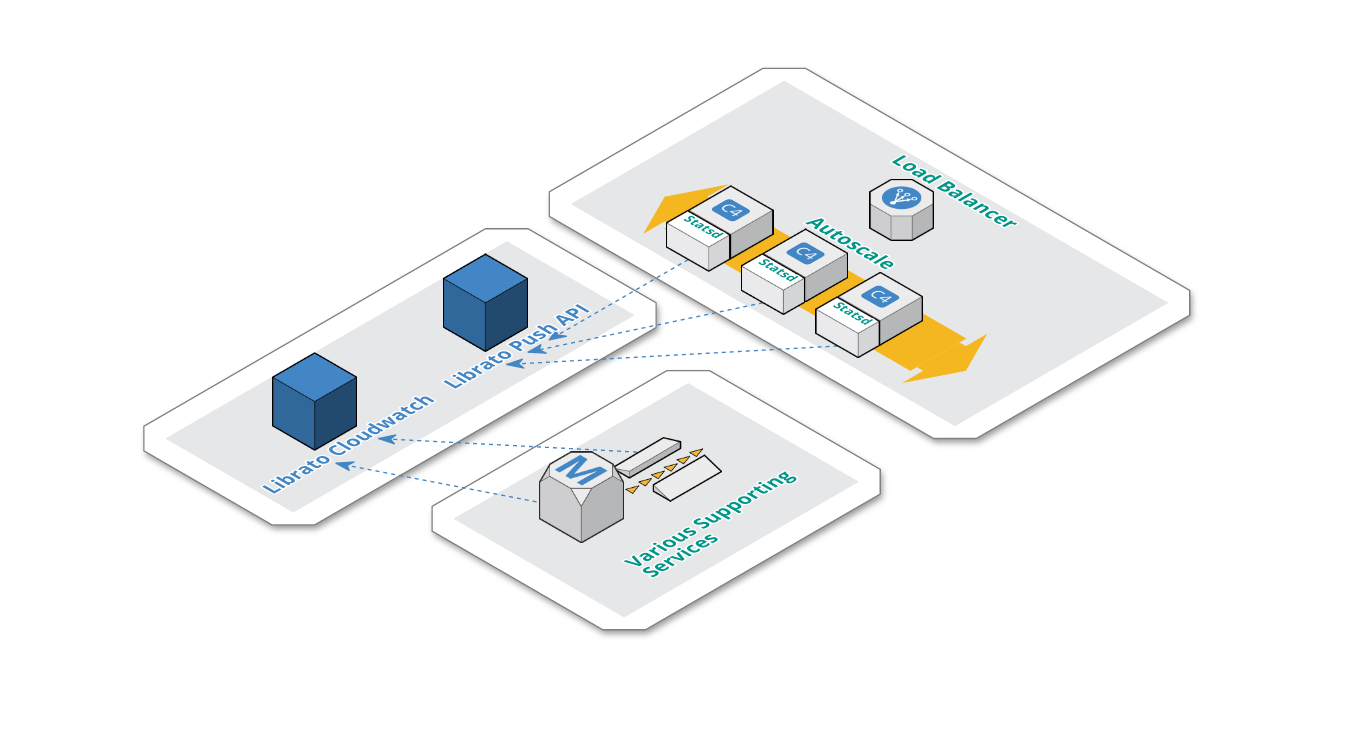
Below you can see the gist of our architecture with respect to our metrics backend (Librato) with major complexity abstracted away.
-
Application nodes, which are autoscaled, each have an instance of Statsd. We’ve made this pragmatic design decision, because Statsd had a low resource footprint on each application node, thus eliminating the need for any highly available centralized Statsd setup.
-
Statsd is configured with a librato backend and flushes metrics via librato push api every 10 seconds.
-
Librato CloudWatch integration pulls metrics about supporting services (SQS, Redshift, RDS).
Librato Cons
Librato pricing can be a bit tricky and hard to wrap your head around, if you’re sending data to them from multiple sources (i.e. nodes) and those node’s unique identifiers are short lived (i.e. autoscale). The costs for such metric streams simply add up in your bill.
We also never fully understood how librato rolls up data. Their complexity around metric periods with respect to rolling up was not really a good fit for us. At times it was really frustrating setting up real time and long term trend dashboards that made sense for us.
Librato dashboard also has no mobile support. This feature turns out to be really important, if you get an infrastructure alert in the middle of the night and are not able to check your metrics from the comfort of your bed.
Librato Pros
Librato is a great pick, if you want to get your metrics backend up and running quickly, since it’s only a credit card away. If you only need to observe a small volume of metrics, then librato can be cost effective, since you pay everything on a per metric per frequency basis.
Librato also comes with a very basic alerting system. Providing you with basic means to set up alerts based on short term trends. Short term? Yes — Librato only allows you to observe a metric trend for 60 minutes and making a decision based on that time window.
A direct AWS CloudWatch integration is a great asset of Librato. You’re able to get all your metrics in a single platform very quickly and that was a great value for us.
You can start pushing in metrics in a manner of minutes. We suggest a statsd to librato integration since they have written a librato backend for statsd (fyi: If you’ll use our “battle tested” fork, you’ll have better support for extracting source names from your legacy metric names).
All in all Librato, is a great service with a few glitches that can outweigh the value of a managed and well supported platform.
Looking for Alternatives
Complexity and volume of our metrics started to grow and so did our interest of looking for better, more cost effective and easier to use metric platform.
We wanted to keep the good parts of our current platform, but we certainly wanted more control and transparency when compiling metrics into dashboards and more control when setting up alert conditions.
The options were:
- Self hosted Graphite + Grafana + Some alerting component (e.g. Cabot)
- Hostedgraphite.com
- OpenTSDB
- Prometheus.io
- Some parts of the TICK stack (Telegraf + InfluxDB + Chronograf + Kapacitor)
We quickly eliminated hosted Graphite since you pay per metric and since we’d like to have short lived server names in our metrics, we would quickly generate a lot of them. This solution wouldn’t be cost effective in the long run.
OpenTSDB seemed too heavyweight, since you need to manage an entire HBase cluster as a dependency.
Promoteheus didn’t seemed like a good fit since we prefer the metric push approach opposed to metric pull.
Self hosted Graphite was a viable option too, but the notion of being able to tag your metrics was a feature in favor of InfluxDB which was our final call.
Out of the box we identified that InfluxDB has no support for composite metrics, but the InfluxDB stack has a component that solves this problem for you (we’ll get to that later in the blogpost).
InfluxDB Killer Feature
I mentioned that InfluxDB by itself has a very appealing feature of being able to tag your metrics. In our case this proves to be exceptionally useful, since we’re building and monitoring a distributed real time bidding platform. We want to be able to take a very fundamental metric bid_throughput and then break it down by host and exchange in our example.
bid_throughput,host=server01,exchange=google    value=20 1437171724
bid_throughput,host=server01,exchange=yahoo     value=21 1437171724
bid_throughput,host=server02,exchange=outbrain  value=23 1437171724
bid_throughput,host=server02,exchange=adsnative value=20 1437171724
Tags in InfluxDB are indexed, which means querying series by tags is very fast. You can make the most use of that by storing data you want to break down by (e.g. you want to use them in GROUP BY) as tags.
On the other hand, tags being indexed means that you want to avoid storing high cardinality data such as random hashes in tags, since that will cause the size of your index to grow without bounds.
Transition to TIGK Stack
- T = Telegraf - replaced statsd as the agent that writes to InfluxDB
- I = InfluxDB itself
- G = Grafana - in our opinion a superiour tool to Cronograf at the moment
- K = Kapacitor - alerting and metric processing system
This stack was our final pick for our metrics platform.
Getting Data in
We use telegraf as a near drop in replacement for statsd. Telegraf has a compatibility layer with statsd with an extension that enables you to utilize InfluxDB tags.
Calls to telegraf are made by our django and go-lang apps directly, using the Zemanta/django-statsd-influx client. (We’ll be opensourcing our Go-lang client soon.)
We have metrics about our managed services (e.g. ELB, RDS, Redshift, SQS) that end up on AWS CloudFront being pushed via a cron scheduled AWS Lambda function. Admittedly, one of our best uses of AWS Lambda so far.
Architecture
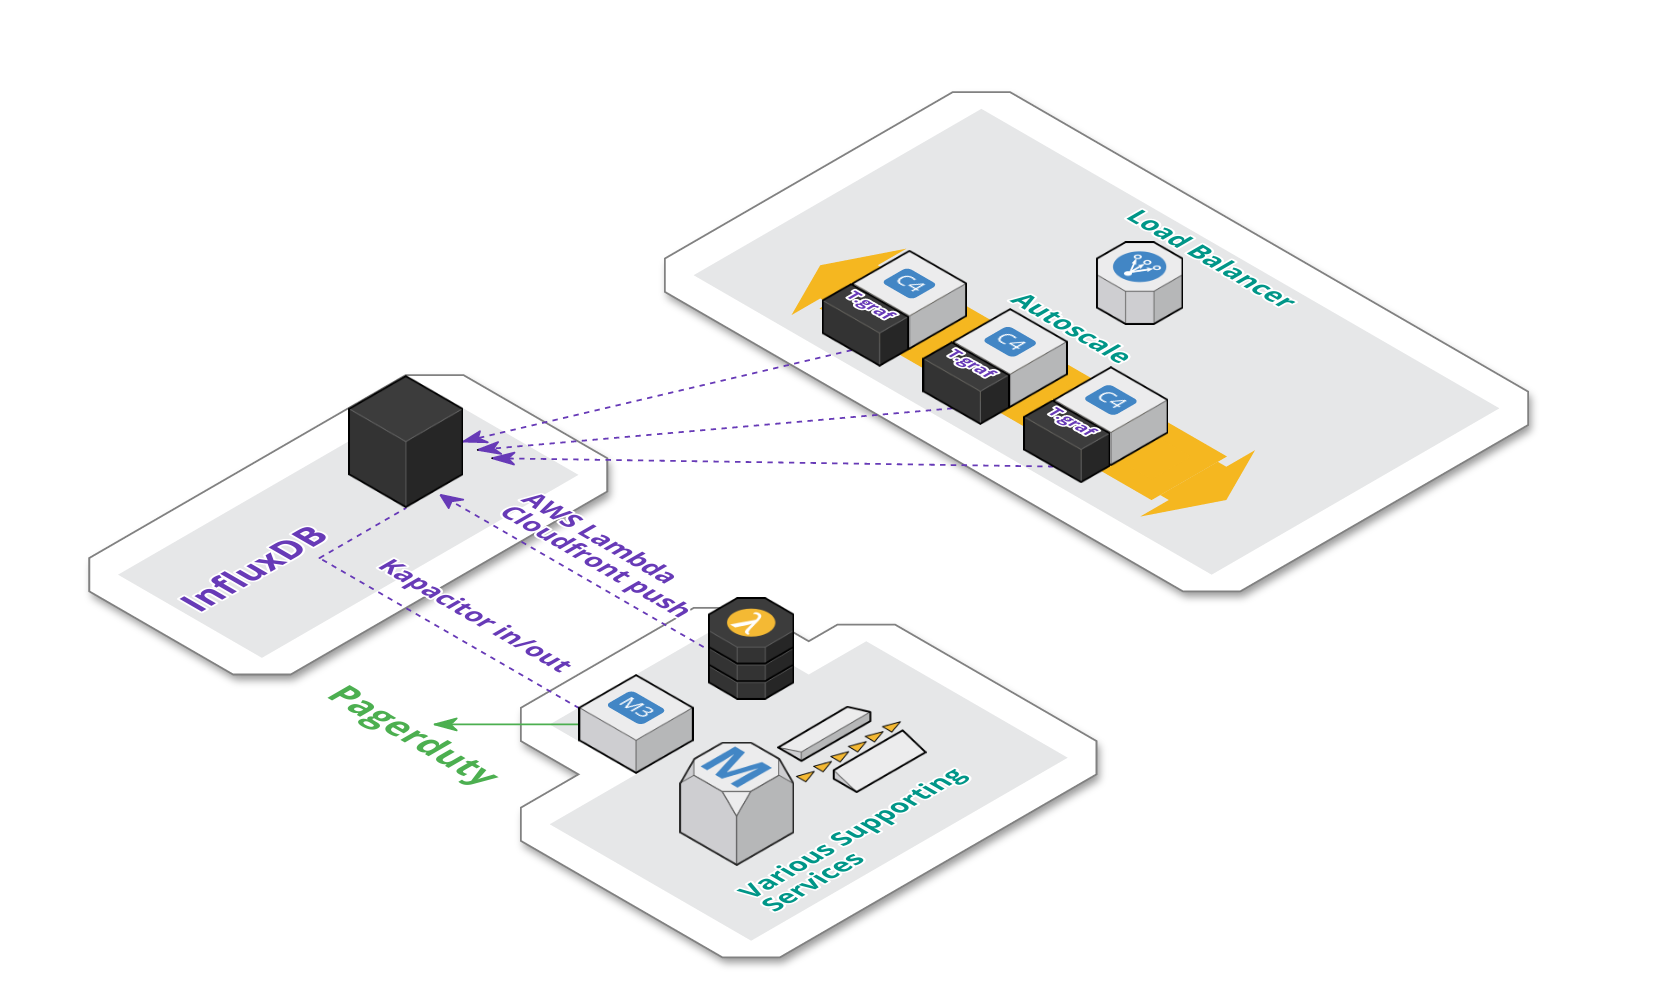
Architecturally, our setup remained fairly unchanged. As seen on the schema below:
-
We’re currently using a managed instance of InfluxDB provided by influxdata.com.
-
Each application server in the auto-scale group still contains an instance of telegraf agent, that aggregate metrics locally and push them to InfluxDB.
-
As mentioned, AWS CloudFront metrics are pushed periodically via AWS Lambda.
-
We also have an additional dedicated backend EC2 instance for Kapacitor. Kapacitor is responsible for materializing composite metrics. The same component is also responsible for triggering alerts on pagerduty.
Metric based Alerting and Composite Metrics
InfluxDB does not have support for implicit composite metrics. Meaning that you’ll not be able to capture 2 metrics, say request throughput and # of cores in a production cluster and then compute avg request throughput per core. On it’s own, InfluxDB will also not be able to invoke an alert based on a metric threshold.
The InfluxDB stack uses Kapacitor (i.e. InfluxDB data processing platform) to solve both problems of triggering alerts and materializing composite metrics back to InfluxDB using either stream or batch mode for metric processing.
Internally Kapacitor uses a data flow based programming model, where data manipulation nodes can be arranged in a directed acyclic graph. You define such DAG via an surprisingly expressive domain specific language — TICKscript.
Grafana
When we hooked up Grafana to InfluxDB, the whole transition to the TIGK stack started making a lot of sense. We were able to create really expressive dashboards that provide actionable insights into our real time data.
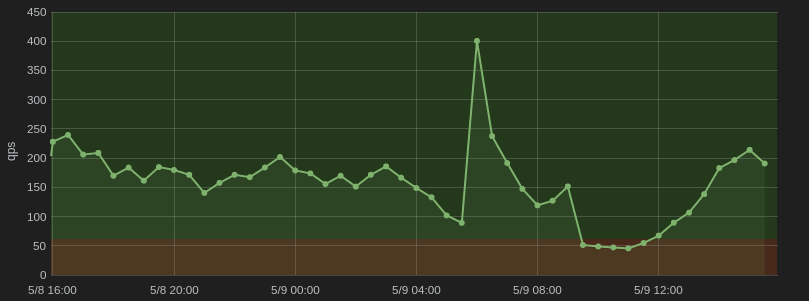
For us it is really valuable to be able to draw out OK and ALERT thresholds explicitly on the dashboard itself and then inline that with either drilldown links or inline markdown documentation — all great core Grafana features.
Grafana and InfluxDB tags
For us, tags became a powerful asset in combination with Grafana templates, since we were able to repeat predefined panels for every tag value in a manner of clicks.
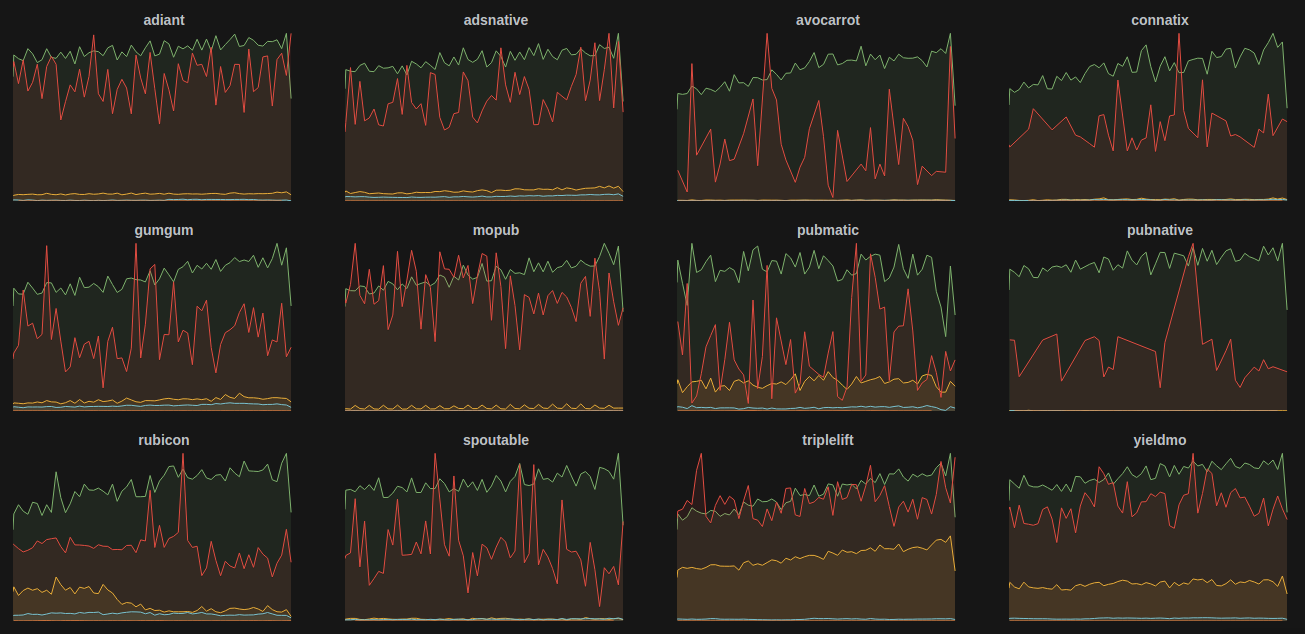
As you can see above, we have a custom tag named exchange (our advertising supply partners) and a couple of metrics we’d like to follow separately for each exchange.
Conclusion
Looking back on our roadmap, from a humble librato beginning, to a more elaborate metric backend stack, we’ve come quite a long way and gathered plenty of experience.
We still have some work on our plates given the current state of affairs, since we’ll soon have to migrate our current managed InfluxDB instance to either the new cloud.influxdata.com offering (we’re currently still on their legacy managed service plan) or migrate to a self-managed version on EC2.
After that we just have to remain focused on nurturing the now freshly created dashboards and make sure only insightful and actionable metrics end up in Grafana.